

Most people are looking for the answer to one question: how much can you earn.
But in trading, this is the wrong question.
The right question is not “how much can you earn”, but what actually drives the result and what range it operates in.
In this article, I will show what potential is built into the Owl Smart Levels system and what drives its performance in practice.
Then you can see how this applies to your own trading — depending on how consistently you are ready to follow the rules and execute the system.
HOW TO EVALUATE ANY TRADING SYSTEM
To understand how the result is formed, you only need to focus on two parameters:
- Risk/Reward (RR) — risk-to-reward ratio
- Winrate — percentage of profitable trades
It is their combination that determines the final result. At the same time, most people focus only on winrate — how many trades close in profit. But by itself, this metric guarantees nothing.
💣 EXAMPLE 1 (High winrate — LOSS)
Let’s break it down with a simple example of 10 trades:
- 7 closed in profit
- 3 in loss
Looks fine. But the final result is -20$.
So how does that happen?
The answer lies in the parameters built into the trade. In this system (RR = 3:1):
- you risk 30$
- and earn 10$
Then the math is simple:
7 × 10$ – 3 × 30$
Result: -20$
This is where it becomes clear: even with a high winrate, you can consistently lose money.
Now let’s see what needs to change just to break even.
With the same number of trades, you need to adjust the RR (for example RR = 2:1):
- reduce the risk to 20$
- keep the profit at 10$
Then:
7 × 10$ – 3 × 20$
Result: +10$
Here’s an important point most people miss. When you increase the risk/reward ratio (RR), trades hit profit less often. In other words, the winrate drops.
💣 EXAMPLE 2 (Low winrate — PROFIT)
Now let’s look at the opposite situation. The same 10 trades:
The winrate is only 30%. At first glance, it looks bad.
But we change the trade logic (RR = 1:3):
- risk: 10$
- potential profit: 30$
Let’s calculate:
3 × 30$ – 7 × 10$
Result: +20$
Even with fewer winning trades, the overall result is positive. This is exactly where the answer to the question “how much can you earn” comes from.
In this model, the result does not depend directly on the number of winning trades. It is driven by a few strong entries that cover a series of losses.
In practice, it looks like this:
- you may spend part of the time at breakeven or in drawdown
- and then 1–2 trades generate most of the result
Moreover, this model does not require a high winrate. To break even, around 25% winning trades is enough — 1 profitable trade out of 3 losing ones already keeps you from losing money.
These two examples show a simple point. The same market, the same number of trades — but completely different results. Everything depends on what RR and Winrate are built into the system.
The question is not how to increase the number of winning trades, but what risk-to-reward ratio is behind them.
This is exactly the model behind Owl Smart Levels.
WHAT RR IS BUILT INTO OWL SMART LEVELS
In the Owl Smart Levels system, the core logic is based on RR = 1:3. The base structure is 1% risk to 3% profit.
This foundation does not change. Because of RR = 1:3, even with a relatively low winrate, the system can remain profitable.
But the winrate can be improved without changing RR. This is where the second level of the system comes in.
By filtering signals, weak and low-quality setups are removed.
As a result: fewer losing trades, higher share of winning ones.
This is what drives most of the performance, because it strengthens an already profitable mathematical foundation.
HOW IT LOOKS WITHOUT FILTERING
To move beyond theory, let’s look at a real example.
I have been maintaining trading reports for the indicator since 2023, recording all trades on EURUSD, GBPUSD, AUDUSD.
Let’s take one of the average months — May 2023. And one pair — EURUSD. Below is a table of all trades for that period.
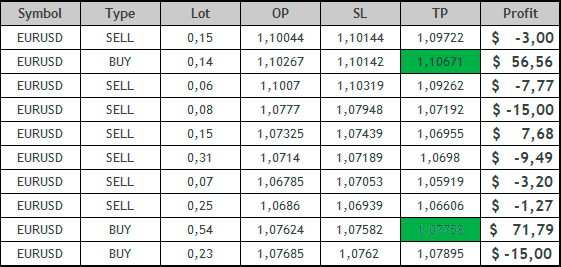
Important: at that time, there was no filtering system. It was just an indicator and its signals.
As a result for the month:
- 7 losing trades
- 3 profitable trades
Final result: +8.1% for the month on one pair.
This is not a maximum or “ideal” result, but one of the normal working periods. In other months, the result may be higher or lower.
It is also important to note that this example shows only one currency pair. The result can be scaled by adding more instruments — in this case, the total result becomes the sum of all of them.
However, this approach also has a downside.
THE MAIN DRAWBACK OF THIS APPROACH
There is one important point that needs to be addressed.
It is not about the system logic, but about how it is perceived during trading.
With a 1:3 risk-to-reward ratio, you will inevitably face losing streaks. This is a normal part of the process. But psychologically, this is hard to handle.
At such moments, it may feel like the system has stopped working, which leads to the urge to:
- skip the next signal
- change the approach
- or stop trading altogether
The result in this system is not a straight line — it is a result of discipline and consistency.
If you ignore this, you may never reach the trades that actually generate profit.

HOW THIS IS APPLIED IN PROP CHALLENGES
This approach has a key advantage — it fits well with PROP firms.
The reason lies in the requirements:
- controlled risk per trade
- drawdown control
- ability to deliver consistent results over time
In this model, what matters is not the number of winning trades, but the predictability of results.
Everything comes down to one thing: how consistently you execute the rules and select trades.
HOW LONG DOES IT TAKE TO PASS A PROP CHALLENGE
There is no fixed timeline.
The challenge is completed through specific trades, not time.
In practice, you go through a sequence of trades, and at some point 1–2 setups generate the main result.
This may happen quickly or take longer — a week, two, or more.
It all depends on whether the market provides such opportunities.
- either through a short series of strong trades
- or over a longer period with multiple attempts
This is a normal part of the model.
METAPHOR
This system is like fishing. You don’t know exactly when the bite will happen.
But when it does — the result comes at once.
And trying to force it only wastes resources.
Trading works the same way. If there are no proper conditions, trying to force results only leads to unnecessary trades and increased risk.
You may simply not last long enough to reach the trades that actually generate profit.
That is why in the Owl Smart Levels system, the goal is not constant trading, but selecting only the right conditions.
Key advantage:
Unlike fishing, where the number of rods is limited, in trading you can work with multiple instruments simultaneously.
This significantly increases the probability of catching opportunities.
But the principle remains the same — you only act when conditions match the system.
SUMMARY
Now you understand what drives results in Owl Smart Levels.
The question is not how much you can earn, but how consistently you can execute this model.
The structure is already there — your job is to execute it.
If you want to explore how the system works in practice: