

Technical analysis is a method used to predict future price movements by studying past market data and looking for specific price patterns. Recognizing patterns can offer valuable insights into potential market trends. One such pattern is the triangle. It’s a geometric shape formed by converging price action. Understanding its nuances can be a game-changer for traders. Let’s delve into the world of triangle patterns.
The 3 Triangle Patterns
A triangle pattern is formed when a price range contracts over time, creating a triangular shape on the chart. This occurs as buying and selling pressures gradually converge. There are three primary types of triangles: symmetrical, ascending, and descending.
An ascending triangle has a flat base and an upward-sloping resistance line as shown in the screenshot below. The ascending triangle is typically considered a bullish price pattern because the upward-moving lows indicate increasing buying interest.

Conversely, a descending triangle has a flat top and a downward-sloping support line. The descending triangle is considered a bearish chart pattern, showing increasing bearish pressure through the lower highs.

A symmetrical triangle is characterized by equal highs and lows and the symmetrical triangle does not have a flat top or bottom. A symmetrical triangle is a neutral pattern and the context in which trending environment it forms is important to understanding its meaning.

What is a triangle telling you?
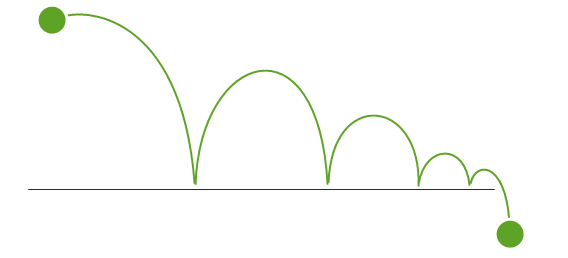
A triangle tells you a lot about the market participants and the current trending situation. The easiest way to understand triangles is by looking at an example outside the world of trading. When you throw a ball it will bounce, but each bounce will be lower than the previous one. The ball is losing momentum and gravity takes over until the energy of the ball is completely gone and it does not bounce anymore.
The same principles apply in trading. The triangle pattern shows a gradual loss of momentum. In the context of a descending triangle pattern, we can see that whereas the buyers pushed the price higher in the beginning, each following bullish trend wave is weaker than the one before, indicating the fading bullish pressure. At one point, there are no buyers left, and the price breaks through the base of the trendline, starting the next bearish market phase.

The same principles apply to the bullish ascending triangle. Ideally, you find an ascending triangle in a bullish market context where the triangle is the consolidation phase after an uptrend.
The ascending triangle shows that the buyers are gaining strength once again during the consolidation. Each bearish push is weaker than the one before, indicating increasing bullish interest as the buyers step in sooner and sooner to drive the price back higher.

How to trade triangles
The first step to trading the triangle pattern is to identify the correct context. Triangle patterns are trend continuation patterns which means that the trader needs to find triangles in a trending market.
The screenshot below shows that the ascending triangle occurred after a bullish trend phase. This is the ideal scenario because the triangle then connects two bullish trending phases.
It is important to stay away from triangle patterns when they do not form in a clear trend.

Waiting for the breakout is essential for timing the triangle entry. Amateur traders are usually impatient and many will jump into a long position before the price breaks above the flat top. This typically leads to losses.
Only when the price breaks the flat top with high momentum and then also closes above the flat top is the entry valid.

When it comes to stop loss placement, traders can choose their favorite approach. Typically, traders place the stop loss below the last swing low. This way, the stop loss is protected by a natural price structure and if the stop loss gets triggered, the triangle pattern becomes invalid.

Exits are personal and traders can choose from a wide variety of trade exit strategies. Whereas some traders prefer to use a fixed reward:risk ratio for their exits, other traders may choose to apply a trailing stop loss technique.
In the example below, we applied the 21 exponential moving average (EMA) and the 50 EMA to the price action. Moving averages are a commonly used tool for trend-following trading. Traders then wait for the price to break one of the moving averages before exiting their trades. This works great in a strong trend.

Triangle patterns and volume
Especially stock traders benefit from using volume analysis together with triangle pattern trading. Typically the price, just before the breakout from the triangle, will form very small candlesticks that are accompanied by lower-than-average volume.
The pattern is referred to as a volume contraction pattern and has been coined by Mark Minervini. The contraction in price and volume are great pattern qualifiers.

The breakout then occurs with higher than average volume and a large momentum candlestick pattern. Only triangle breakouts with high volume should be considered valid in stock trading.

After the initial breakout, the price came back to the flat top, and tested it successfully as support. The push away during the retest also showed a high-volume candlestick with great momentum.

Final words
To recap the triangle trading guide, here are the most important points and tips when it comes to understanding and trading triangles:
- Triangles are trend continuation patterns
- Only look for triangles in a trending market
- The price pushes away from the flat top/bottom showing a loss in momentum
- A triangle must have multiple weaker pushes
- The breakout must show high momentum
- Just before the breakout, the price candles show a loss of momentum and lower volume
- The breakout occurs with higher than average volume
- The stop loss is typically placed below/above the last swing